How design solved the dissatisfaction problem that was affecting the customer experience.
Team
Blue Rivera | Product Designer
Yuzo | Product Owner
company
SoluCX
year
2020
Product
Dashboard
The Challenge & Goals
Enhance customer data visualization experience, aiming to elevate the product's value through a customizable platform. Additionally, explore upselling opportunities by providing personalized dashboards tailored to their unique needs.
1
Elevating Product Value
Discuss strategies to elevate the product's perceived value through enhanced data visualization.
2
Personalized Dashboards
Deep dive into the significance of personalized dashboards and Illustrate how tailoring dashboards to unique customer needs can increase customer satisfaction.
3
User Experience
Discuss how these improvements align with creating a customizable and value-driven platform.
4
Surveys and Questionnaires
Include questions about challenges they face, features they find confusing, or aspects that could be improved to uncover pain points.
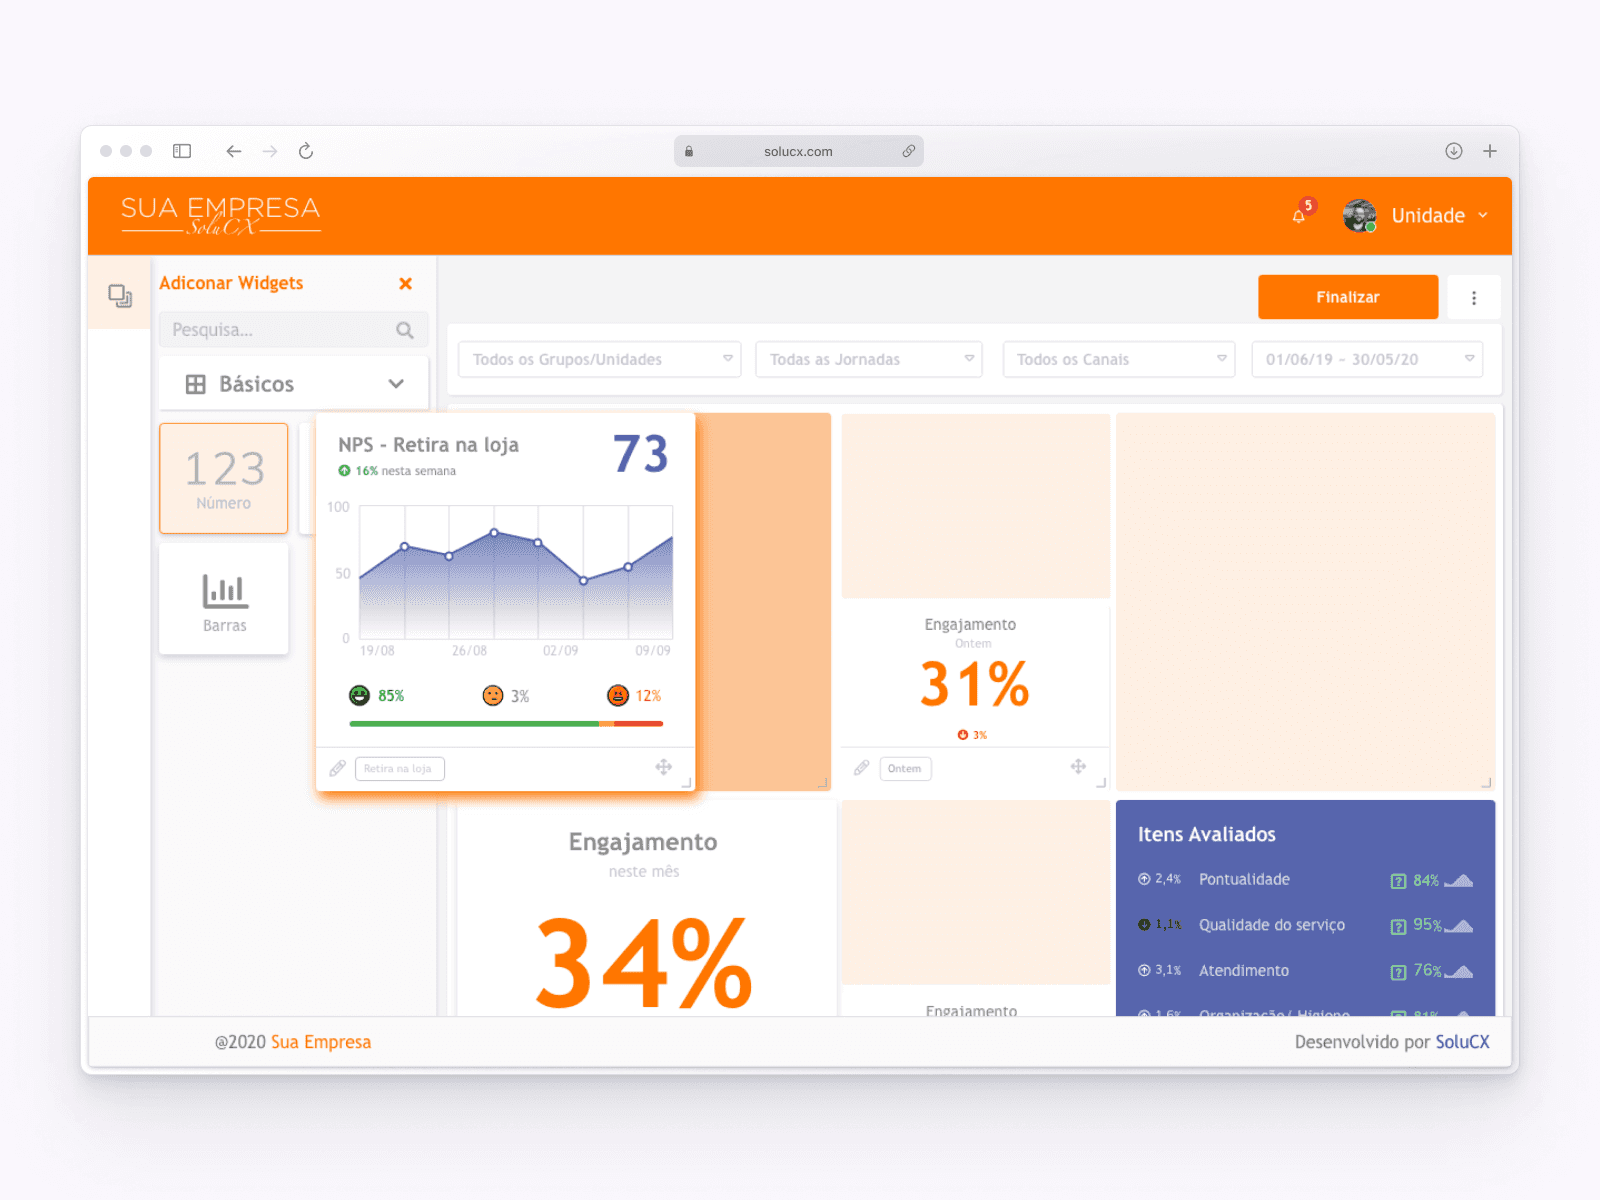
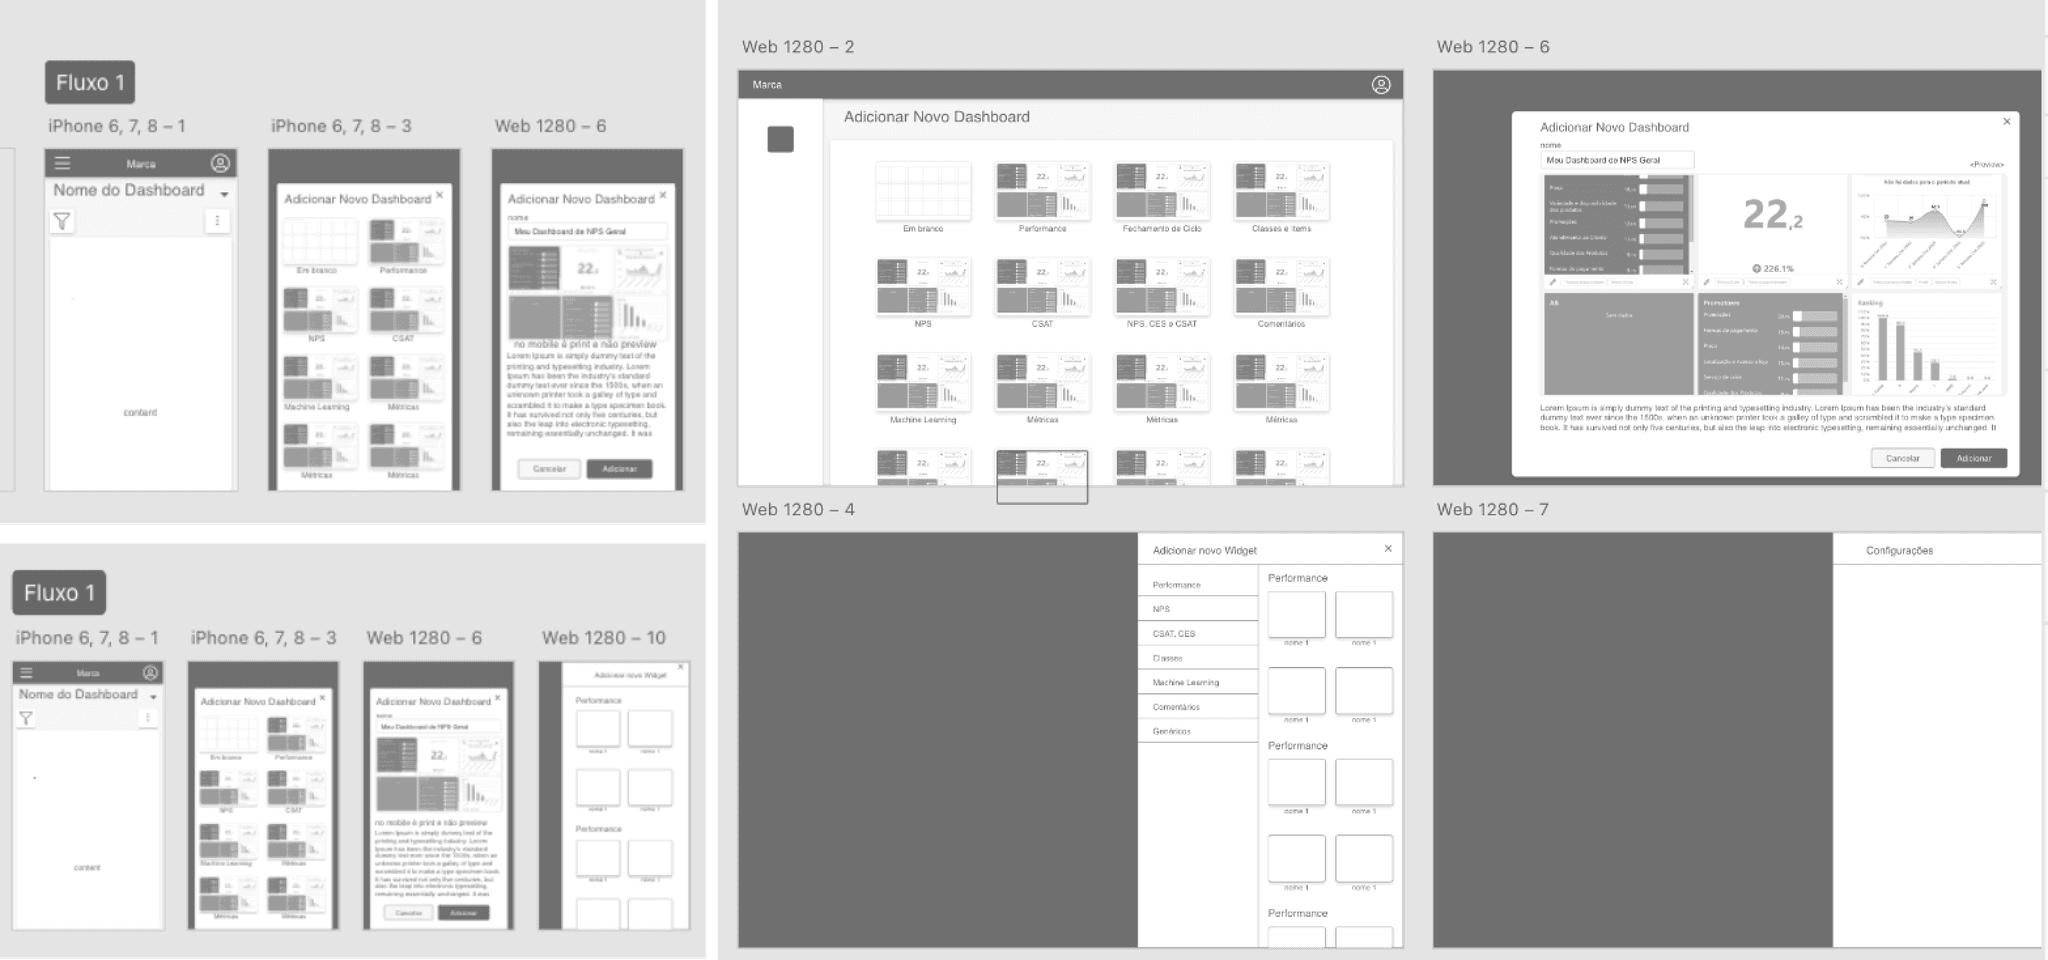
The solution
A dashboard that previews various layout models, allowing users to conveniently choose their preferred configuration type without navigating through the panel.
Additionally, users can create an entirely new dashboard from scratch if desired. The overall design emphasizes a clean and intuitive layout, enhancing user experience with a more streamlined and user-friendly interface.
Widget Selection and Configuration
The user can choose the best widget and configure the data and settings for each indicator on the same screen.
Organized Widgets by Categories
The widgets are separated by categories and organized with a thumbnail, allowing the user to preview them without needing to add the widget.
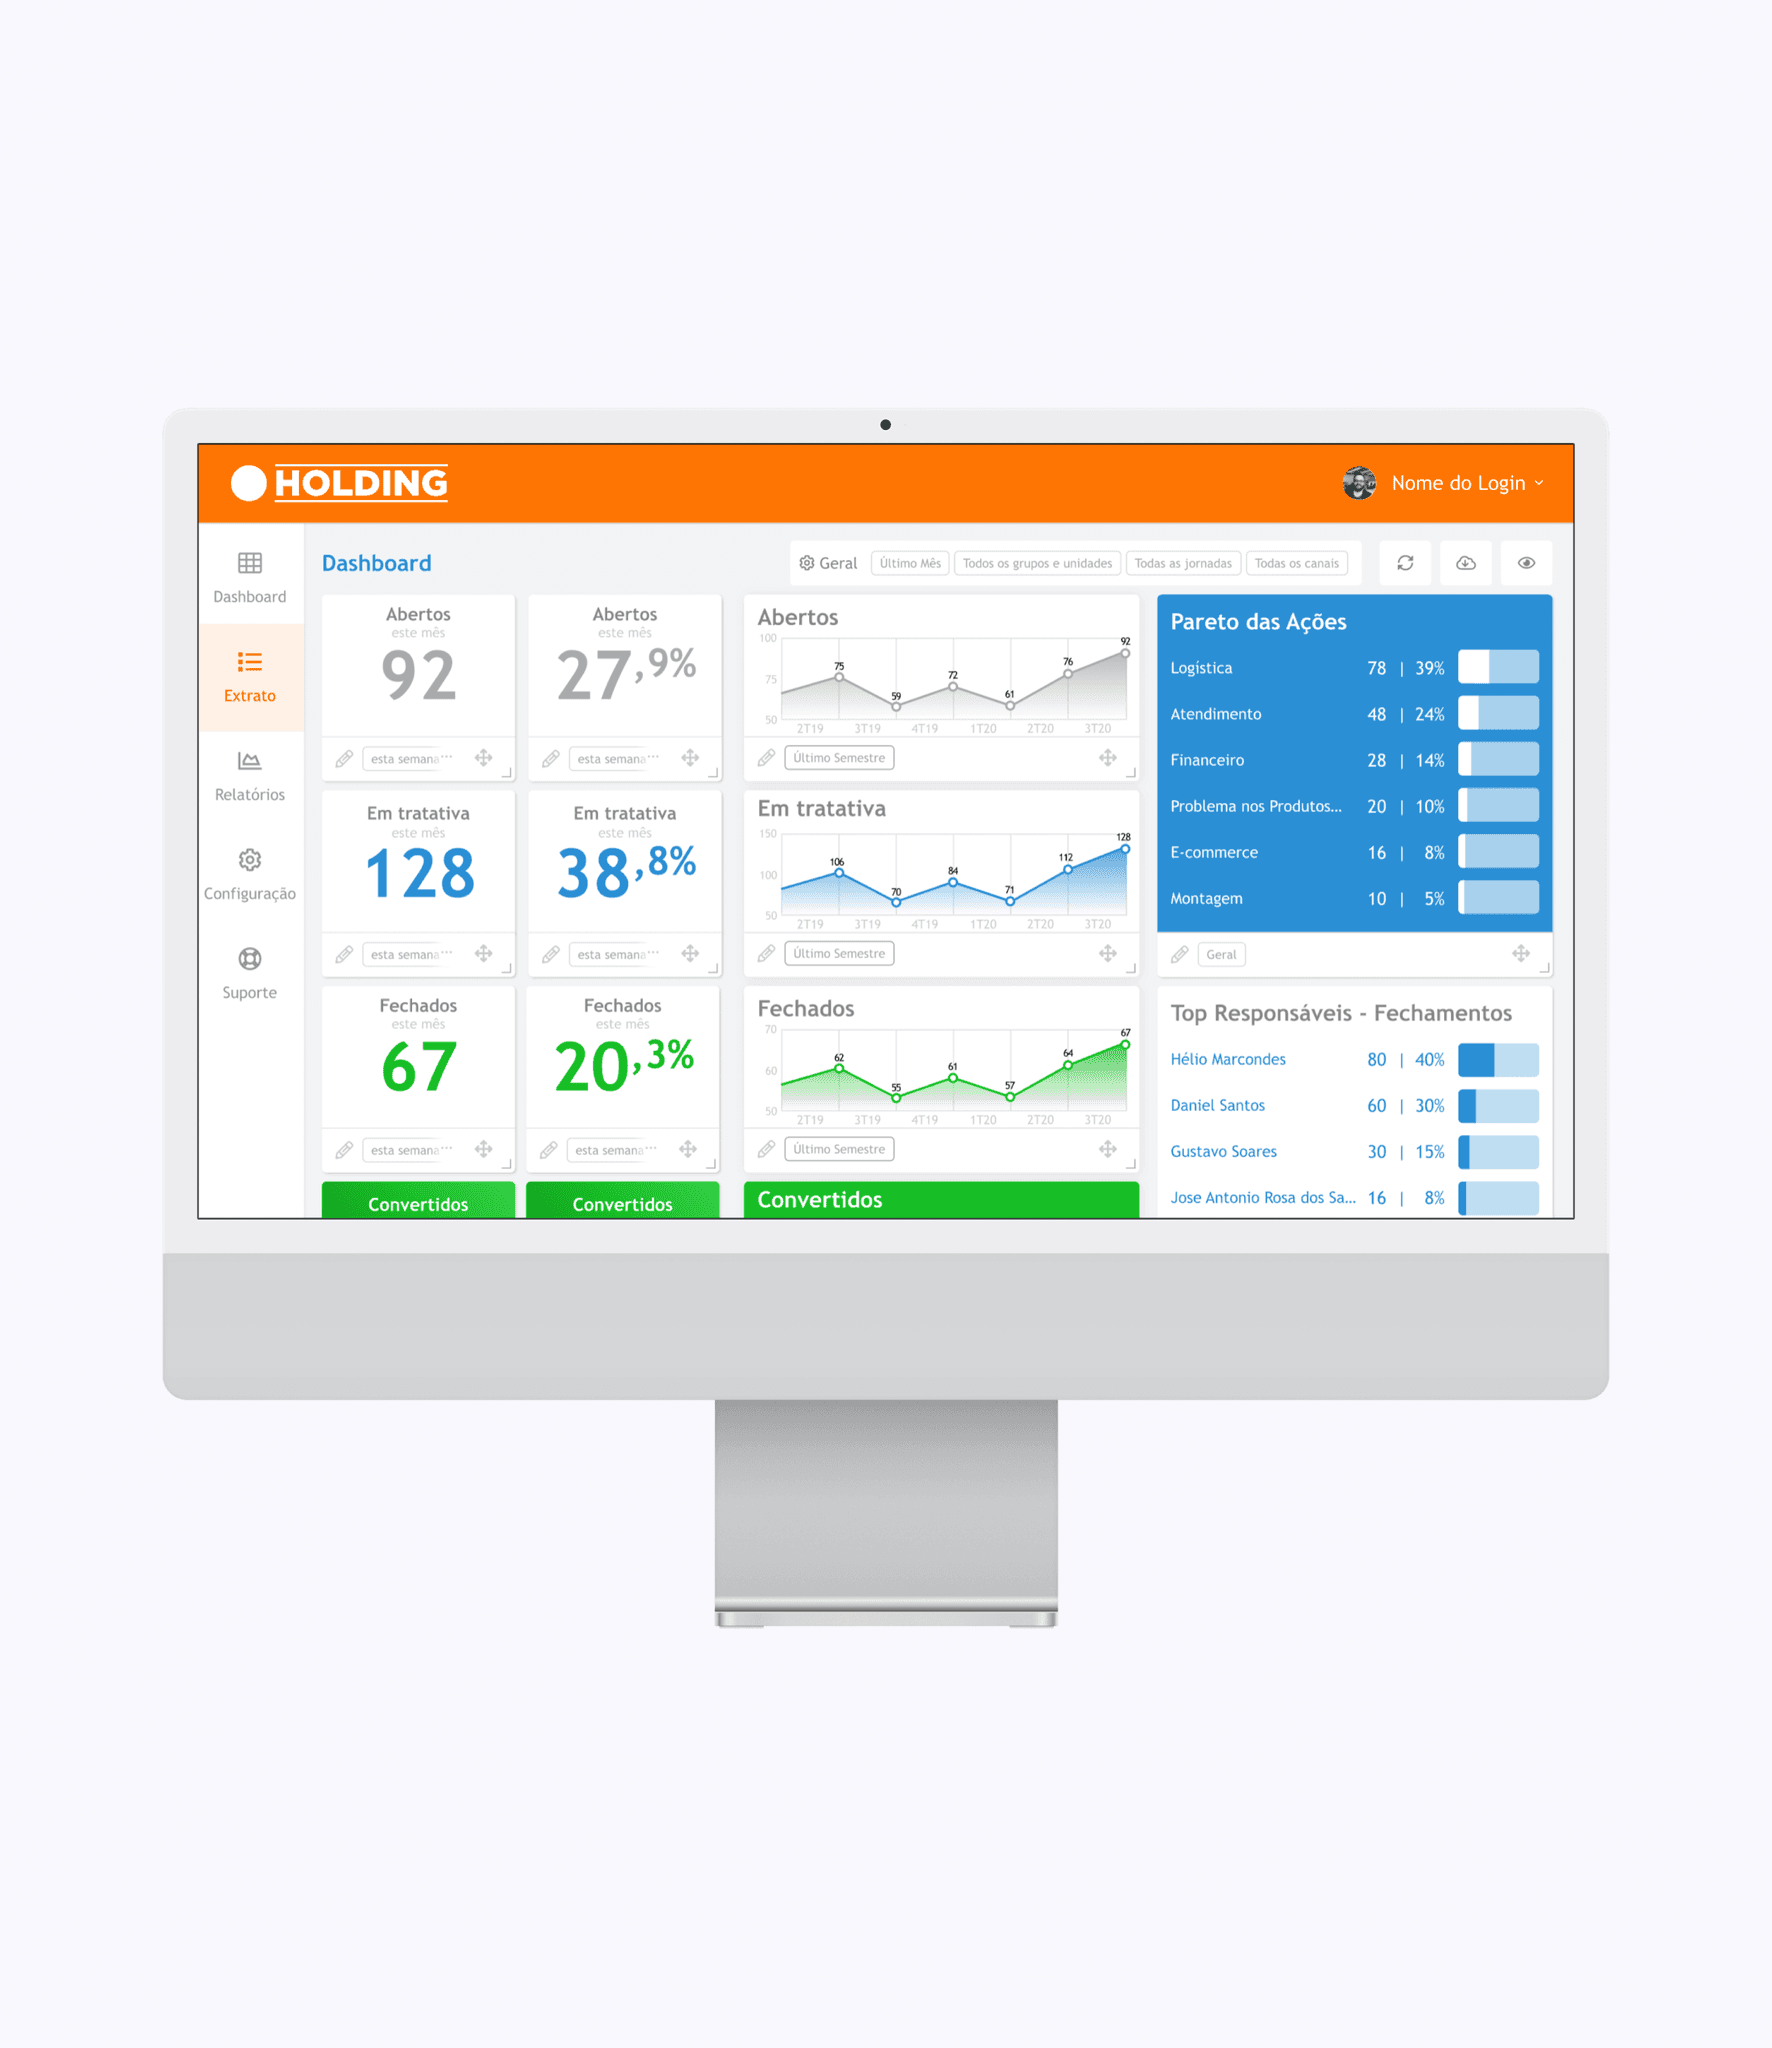
User-Friendly Widget Configuration
The configuration menu and quick access buttons are on the same screen.
New Set Up
The user can customize and configure a new dashboard to meet their preferences.
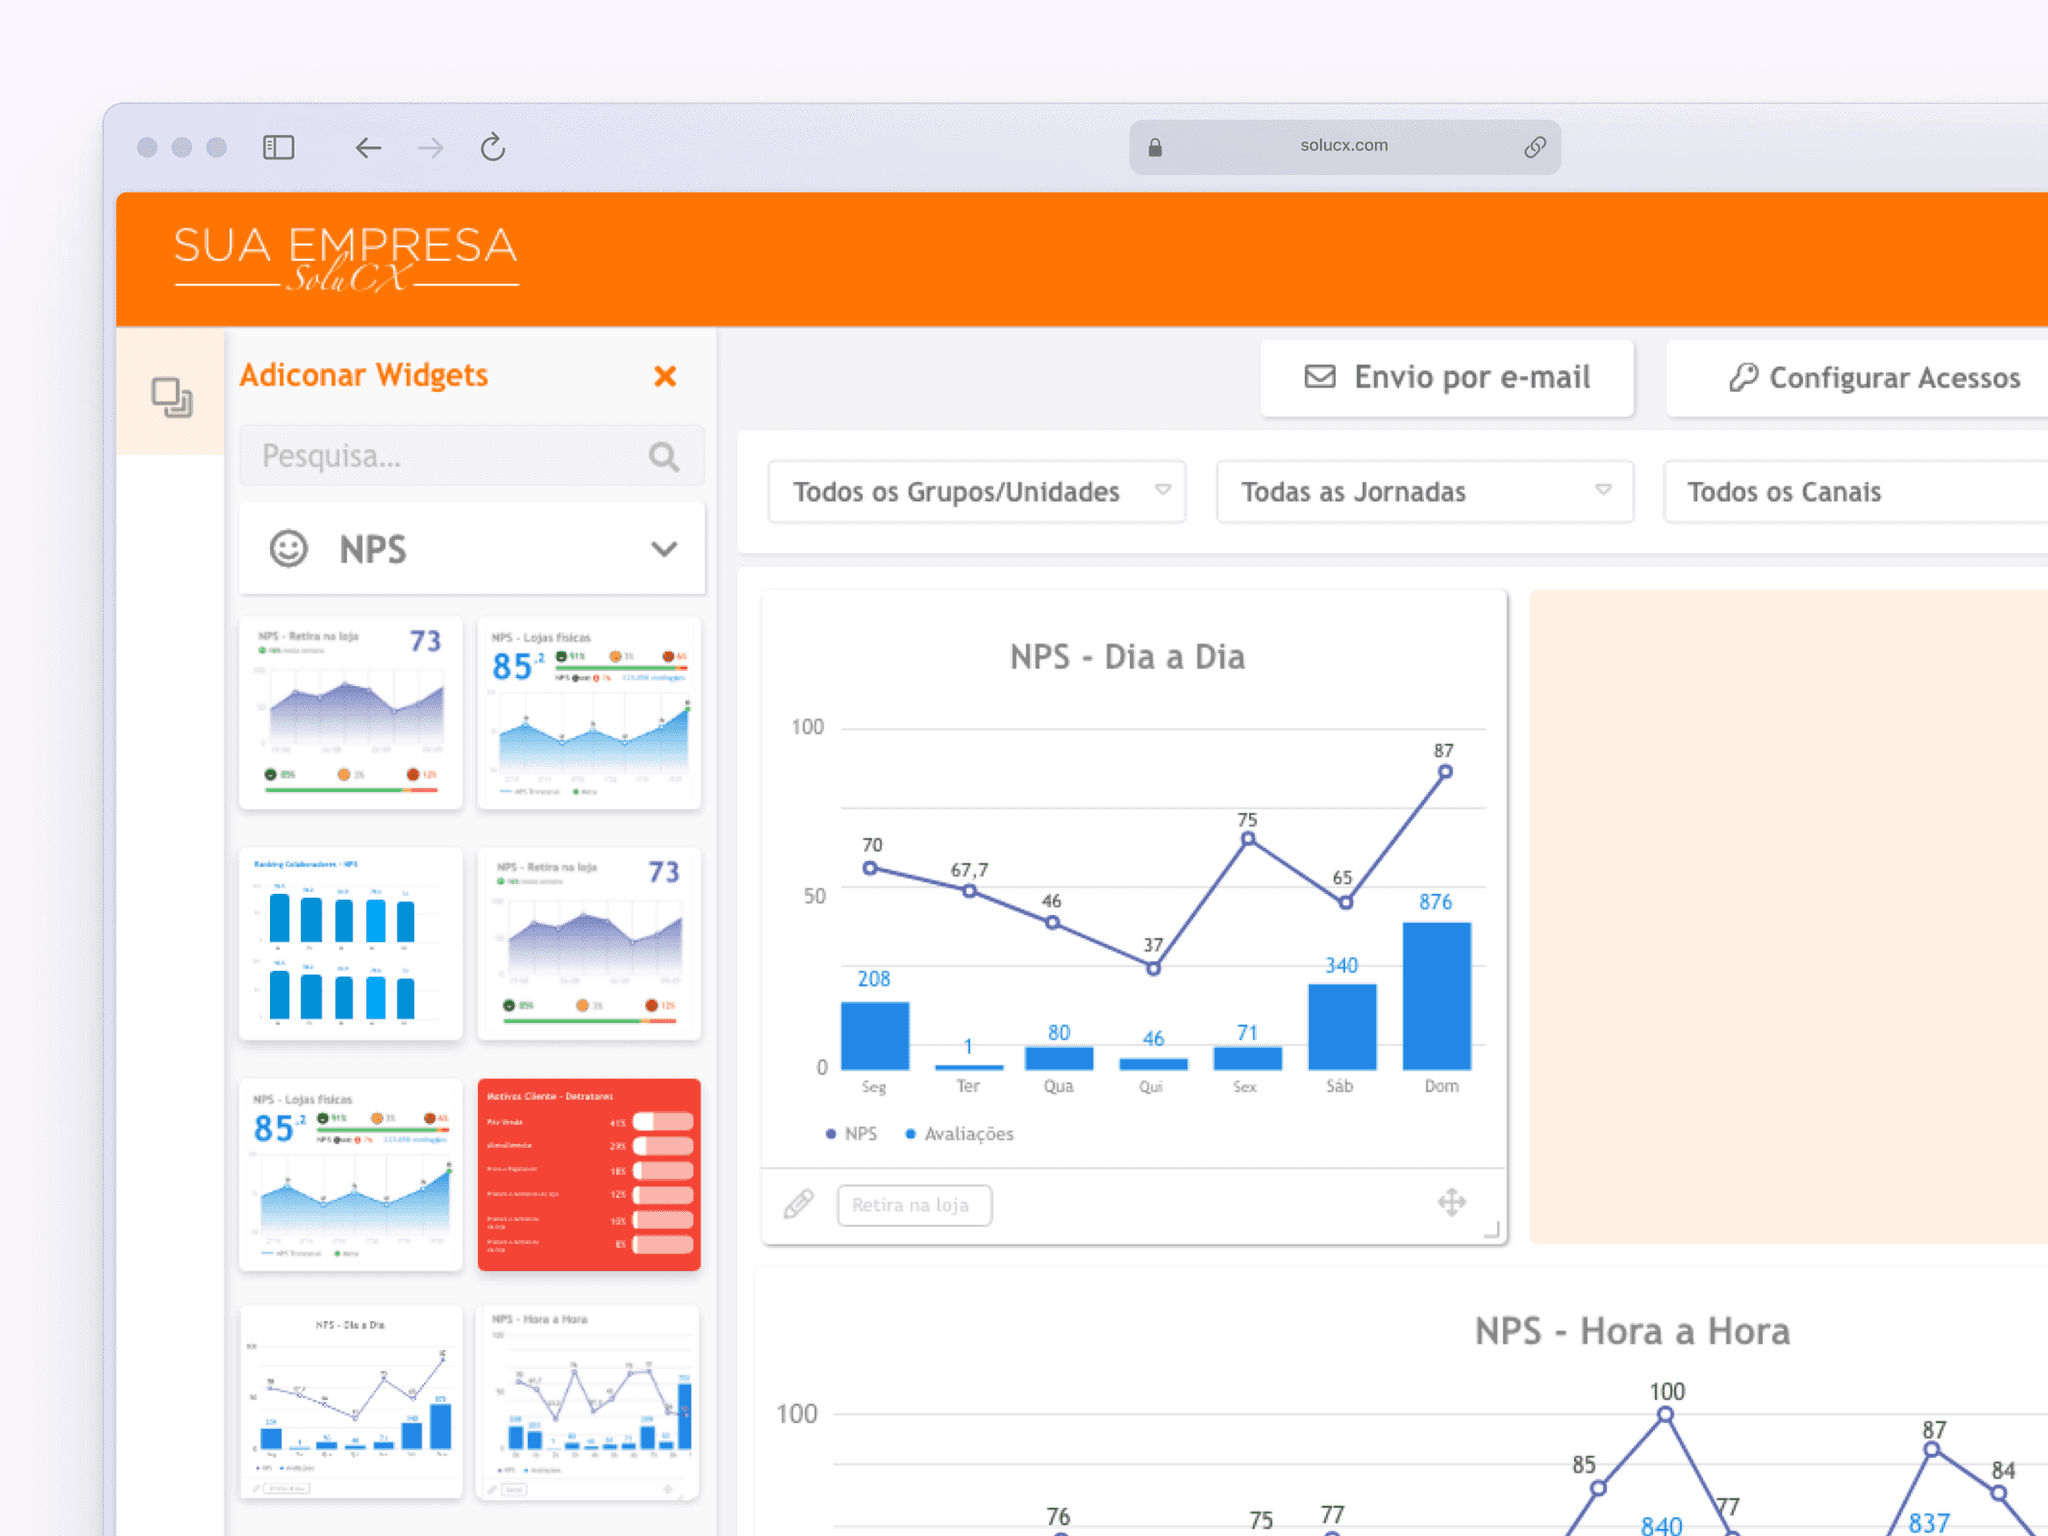
Interactions
By clicking and dragging the widget to the dashboard, the user can explore different ways to create their dashboard with simple and intuitive interactions.
Mobile
We conducted a survey to comprehend mobile device usage and found that the feature was predominantly utilized on computers. The screen resolution data from this survey led me to the understanding that it would serve primarily as a viewer on mobile rather than for construction purposes.
Therefore, users receive only a screen preview. Those accessing this part of the system typically rely on desktops for configuration.

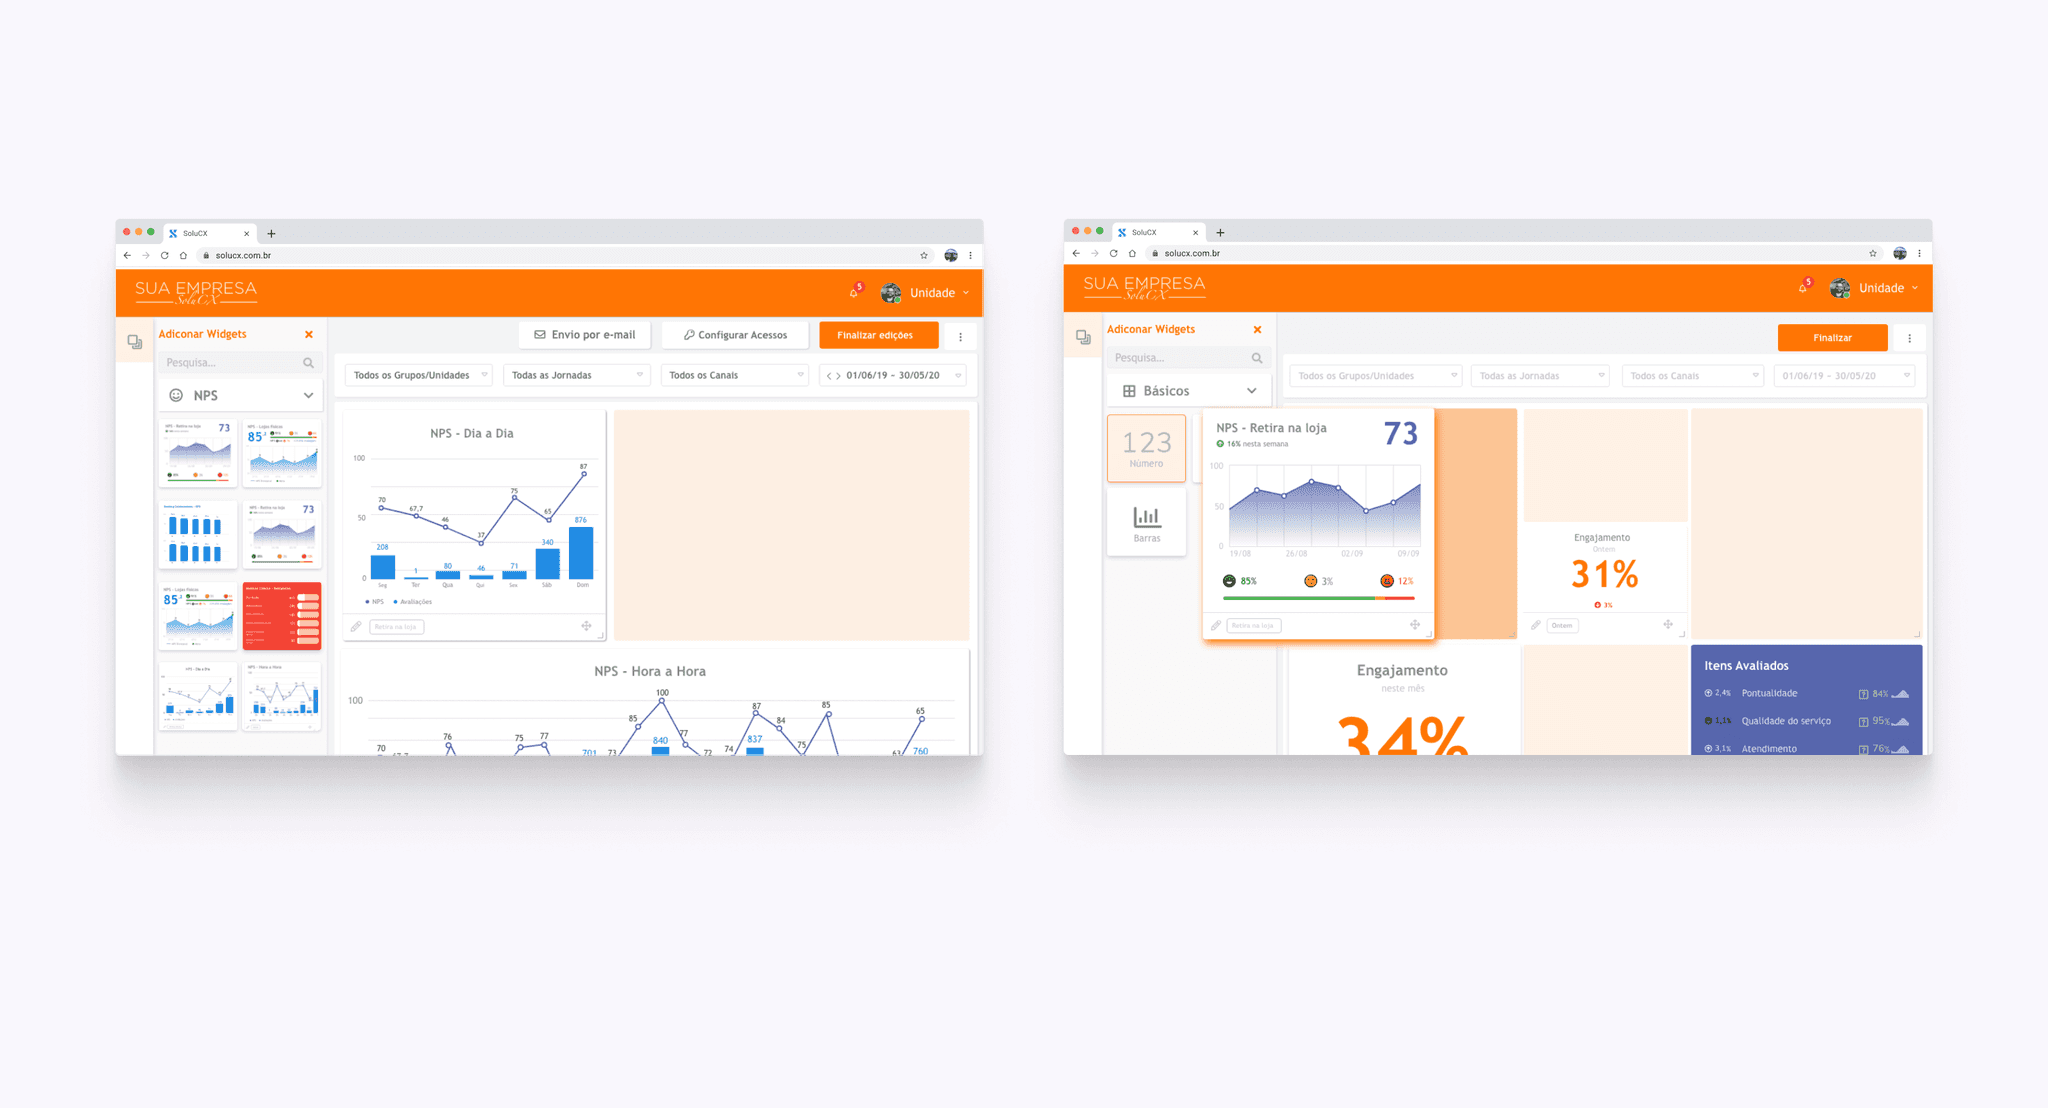
Dashboard View Even for Mobile
For mobile, the widget is for viewing only; users are encouraged to configure widgets on desktop as a way to prevent errors and limit user actions."
Dashboard View Even for Mobile
Straightforward exchange filters, enhancing your preview capabilities.
Organized Widgets by Categories:
Users can effortlessly visualize data at any time, with a simple and easy interface.
Wireframes
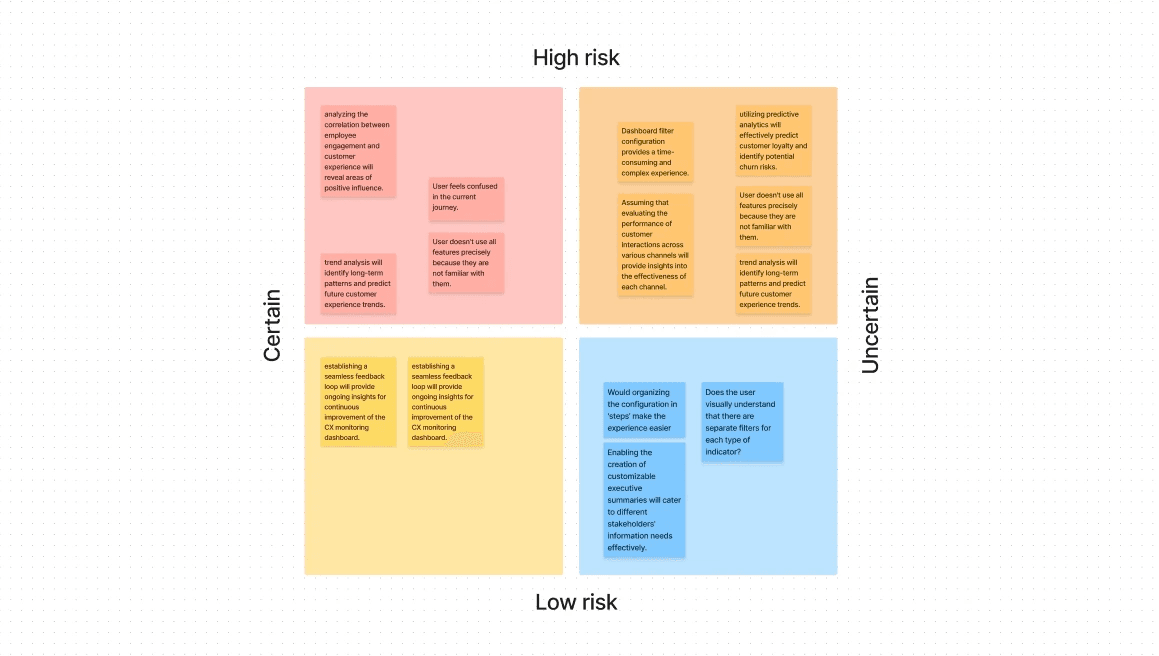
Discovery
For this challenge, I look through existing data resources to gain insights. I needed to identify the pain points. Looking at the data, I decided to create an Assumption Map regarding this feature in-depth into this feature.
The main focus for this feature was the Analyst Profile.
I've utilized Google Analytics to examine data and analyze a sample of the devices most commonly used by analysts.
Define
The priority for this new feature was high, so we would rather design the experience only for the Analyst as a way to collect quick feedback to start gathering insight into the next profile.
What I considered:
1
Desktop Version First
In this case, data showed us that devices were the most critical access for Analysis.
2
Testing and Optimization
Conducting thorough testing and optimization on the desktop version enables you to identify and address potential issues before adapting the design for mobile devices.
3
User Experience Focus
Prioritizing user experience on desktop devices allows you to fine-tune interactions and design elements for a larger screen, potentially enhancing the overall user experience.


MORE PROJECTS
Product Design Cases Studies
I've assembled a collection of my recent Product Design projects to highlight my process.

See More Projects